Homework 5, Problem 1: The Game
of Life
[50
points; individual or pair]
Submission: Submit your hw5pr1.py file to the submission server
The Game of Life is a cellular
automaton invented by John Conway, a mathematician from Cambridge. The game
of life is not so much a "game" in the traditional sense, but rather
a process that transitions over time according to a few simple rules. The
process is set up as a grid of cells, each of which is "alive" or
"dead" at a given point in time. At each time step, the cells live or
die according to the following rules:
- A cell that has fewer than two live neighbors dies (because of
loneliness)
- A cell that has more than 3 live neighbors dies (because of over-crowding)
- A cell that is dead and has exactly 3 live neighbors comes to life
- All other cells maintain their state
Although these rules seem
simple, they give rise to complex and interesting patterns. For more
information and a number of interesting patterns see http://en.wikipedia.org/wiki/Conway's_Game_of_Life.
In this lab, you will implement
a Python program to run the Game of Life.
As always, it is important to break the problem down
into pieces and develop the program in stages so that others can understand the
code and so that you can ensure that each piece is correct before building on
top of it. We will break this problem down into the following steps:
- Creating a 2d
array of cells
- Displaying the
board (in various colors) and updating it with new data
- Allowing the
user to change the state of the cells
- Implementing
the update rules for the "Game of Life"
- (Optionally)
Running and stopping the simulation
Before you start, you need to develop a scheme for
keeping track of your data. Basically, the data you need to maintain are the
states of all of the cells in the board. We suggest that you keep track of this
data in a 2D array of integer values, where 0
represents an empty (off) cell and 1
represents a live (on) cell.
First, in your hw5pr1.py file, copy and test this example function:
def createOneRow( n ):
""" returns rows of n
zeros... You might use
this as the INNER loop in createBoard
"""
R = []
for col in range(n):
R += [0]
return R
This function offers a starting-point for creating one-dimensional
lists -- but the same idea applies for building nested list structures
arbitrarily deep.
Building on this example, write a function named createBoard( width, height ) that creates and returns a
new 2D list of height rows and width columns in which all of the data elements
are 0 (no graphics quite yet, just a Python
list!). For example,
>>> createBoard( 3, 3 )
[ [0,0,0], [0,0,0], [0,0,0] ]
One approach to createBoard is to use a pair of nested
loops: the outer one for the rows, and the inner one for the columns (note that
you can use createRow for the inner loop. Then,
the overall 2d array would accumulate those rows one at a time (within the
loop) until it was the correct size. Note that just as
R += [0]
adds a zero to the end of the list (row) R,
by the same token,
B += [ [0,0,0] ]
adds a row of three zeros to the end of list
(board) B. When you write createBoard, that row will have a name
(maybe R), rather than
hand-typed values.
Displaying
your 2d board of cells
You no doubt noticed that when Python prints a 2d list,
it blithely ignores its 2d structure and flattens it out into one line (perhaps
wrapping, if needed). In order to display your board in 2d using the csplot
graphics module, you will need
to download csplot.py
from this link. =csplot.py= has changed
from previous weeks so be sure to delete any old versions you have and then
re-download it.
A convenient place to download csplot.py is to your desktop. Though the desktop is
easy, any folder you choose is OK. Wherever you put it, you will need your hw5pr1.py file to be in the same
folder as
csplot.py.
Next, in order to use the functions in csplot, include the following line at the top of
your hw5pr1.py file:
import csplot
Now, once you load your hw5pr1.py file into the Python
shell, you should be able to create and display a 2d array with
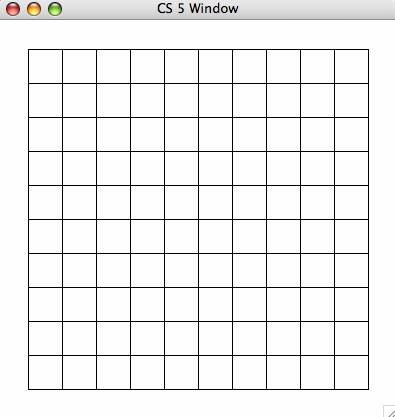
>>> B = createBoard(10,10)
>>> csplot.show(B)
You will see a rather desolate-looking board:
Recall from a few weeks ago
that this CS plot window will not close unless you use the done() command. To
refresh the window you can type:
>>>
csplot.update()
To close the window, type:
>>> csplot.done()
and then click the red X in the
corner of the cs plot window.
Adding patterns to your 2d board of
cells
In order to get used to using 2d arrays of data and
writing functions that modify
arrays rather than return them, copy this function named update1( B )
into your file:
def update1( B ):
""" Takes an empty board as
input and modifies that board
so that it has a diagonal strip of
"on" cells
"""
width = len(B[0])
height = len(B)
for row in range(height):
for col in range(width):
if row == col:
B[row][col] = 1
else:
B[row][col] = 0 # else not needed here, but OK
This function, update1 takes as input a blank 2d array of
data, B.
Then, it changes some of that data so that B becomes a board whose
cells are empty except for the diagonal
where row == col.
Note that it does not
return anything. Also note that we determine the height and
width of the board directly from the board itself.
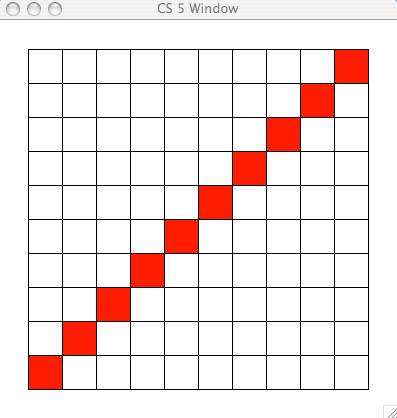
Try displaying the result with
>>> B = createBoard(10,10)
>>> update1(B)
>>> csplot.show(B)
Warning!! The coordinate system of Python's printing
and csplot's graphics system have the rows going in opposite directions. That
is, when you print a 2d array (list of lists), the zeroth row is at the top,
then the first row is next, and so on. However, csplot uses mathematical
coordinates (rows increase along the y-axis and columns increase along the
x-axis), so that the zeroth row is at the bottom, the first row is the
second-from-bottom, and so on. Thus, when you display this new board, you
should get a window that looks something like this:
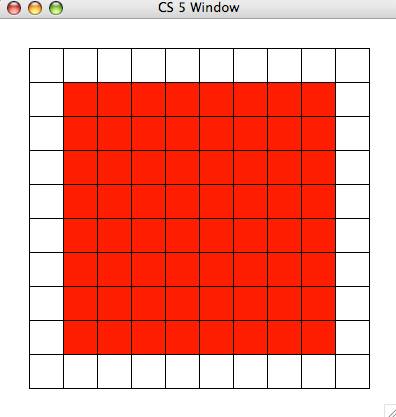
Based on the example of update1,
write a variation named update2( B ) which returns a board of all live cells, except for a one-cell-wide
border of empty cells around the entire edge of the 2d array. Copy-and-paste is
your friend! For example, when you run
>>> B = createBoard(10,10)
>>> update2(B)
>>> csplot.show(B)
you should get a window that looks something like this:
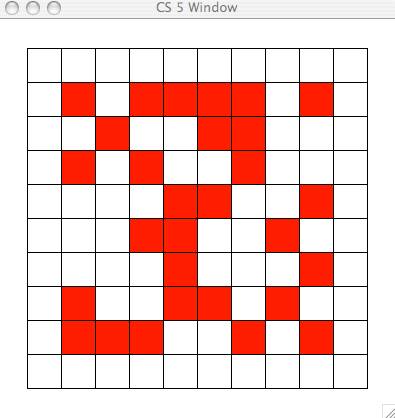
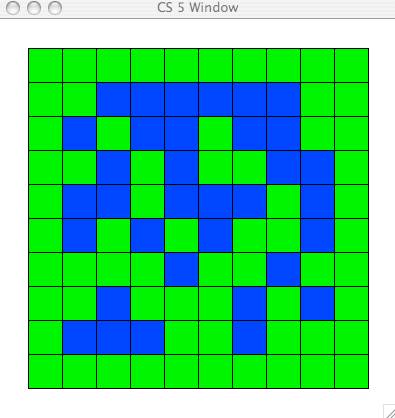
Next, create a function named updateRandom( B )
which takes a board B and mutates that board to contain one-cell-wide border of
empty cells around the entire edge of the 2d array, just as in the previous
case. However, each of the inner cells should be randomly chosen to be live or
empty. Recall that random.choice(
[0,1] ) will help here -- and that you will need to include
the line import
random somewhere near the top of your file.
Here is one possible such board:
A
note on changing cells' colors
You can choose different colors by using a second input called a dictionary to the csplot.show
command. For example,
B = createBoard(10, 10)
updateRandom(B)
d = {0:'green', 1:'blue'} # dictionary
of int/color pairs
csplot.show(B,d) # optional second
argument
will produce something similar in spirit to this:
Creating a new "board" from
an old one...
None of the update functions so far depends on a
previous "generation" of cells. For our life game we need to update
the cells from one generation to modify a NEW board in the subsequent
generation.
Write a function updateReversed( oldB, newB ) that
takes an old board and a blank new board and modifies the newB such that each cell is the
"opposite" of oldB's
cells. That is, where oldB[row][col] is a 1, the new board's value will be a zero -
and vice versa. This function should not return anything.
But,
keep the outermost edge of cells empty, regardless of their state in the
original board - this will help when implementing Life, because it will prevent
out-of-bounds errors.
Recall that you can obtain the width and height from oldB:
width = len(oldB[0])
height = len(oldB)
Try out your updateReversed by
displaying an example:
>>> B = createBoard(10,10)
>>> updateRandom( B )
>>> csplot.show( B )
>>> newB = createBoard( 10, 10 ) # makes newB reference a NEW board...
>>> updateReversed(B, newB)
>>> csplot.show( newB )
It's important that you first make a NEW array of data
to pass into the updateReversed function. You might
point out that it would be possible to simply change the input oldB, rather than have two
inputs - this is true for the reversed-board example, but not true when
implementing the rules of the Game of Life. There, you will need new data on
which to place each subsequent generation.
Writing
a Life-updating loop
To start updating one generation of cells to the next,
read over the following skeleton and then adapt - or simply copy - it into your hw5pr1.py file:
import time
def life( width, height ):
""" will become John Conway's
Game of Life... """
B = createBoard( width, height )
updateRandom( B )
while True: #
run forever
csplot.show(B) # show
current B
time.sleep(0.25) # pause a bit
oldB = B # just a
reminder for us humans
B = createBoard(width,
height) # creates
a new board
updateReversed( oldB, B ) # sets
the new board correctly
Be sure to import time,
as noted above the function. The while loop here will run forever - or until you
hit control-c and will continue to
display reversing boards as it goes.
For debugging and increased user control it will be
important to allow the user to specify which cells are on and which are off at
the beginning of the simulation. To allow this control, copy and paste the
following code at the end of your hw5pr1.py file.
def life( width, height ):
""" will become John Conway's
Game of Life... """
B = createBoard( width, height )
csplot.showAndClickInIdle(B)
while True: #
run forever
csplot.show(B) # show current B
time.sleep(0.25) # pause a bit
oldB = B # just a
reminder for us humans
B = createBoard(width,
height) # creates a new board
updateReversed( oldB, B ) # sets the new board correctly
Here's what should happen when you run this function
(e.g. by calling life(10, 10)). You will see a blank 10x10 grid appear,
but this grid will not update automatically as before. Instead, you should
click on the display window so that it is the current top window. Then, hold
down the s key and click inside one
or more of the cells in the display. You should see those cells change from
live to empty and vice-versa. Once you're ready, close the display window, and you will see
another display window appear, starting with the board that you created by clicking (NOT the original blank
board) and automatically updating as before.
So, for this step, change your life function so that it calls
a new function named updateNextLife(
oldB, newB ) in place of updateReversed, above. Then, implement the updateNextLife( oldB, newB )
function so that it sets each cell in the new data according to the updating
rules based on the old generation, oldB:
- A cell that
has fewer than two live neighbors dies (because of loneliness)
- A cell that
has more than 3 live neighbors dies (because of over-crowding)
- A cell that is
dead and has exactly 3 live neighbors comes to life
- All other
cells maintain their state
As suggested in updateReversed, always keep all of the outer-edge cells empty. This is simply a matter of
limiting your loops to an appropriate range. However, it greatly simplifies the
four update rules, above, because it means that you will only update the
interior cells, all of which have a full set of eight neighbors. You may want
to write a helper function, countNeighbors for example, for
determining the number of live neighbors for a cell in the board at a
particular row and col.
Warnings/hints: there
are a few things to keep in mind:
- Count
neighbors only in the old generation oldB. Change only the new generation, newB.
- Be sure to set
every value of newB (the new
data), whether or not it differs from oldB.
- A cell is NOT
a neighbor of itself.
- A 2x2 square
of cells is statically stable (if isolated) - you might try it on a small
grid for testing purposes
- A 3x1 line of
cells oscillates with period 2 (if isolated) - also a good pattern to
test.
Once your Game of Life is working, look for some of the
other common patterns, e.g., other statically stable forms ("rocks"),
as well as oscillators ("plants") and others that will move across
the screen, known as gliders ("animals/birds").
Adding pause/resume (or other user
options) [Up to +5 points]
For this optional extension, you can no longer run your
code from within IDLE for reasons that are too complicated to explain here.
Instead you will need to run python from the command line (e.g., the Terminal,
or Shell). Here's how to do this:
Open a terminal window and change your directory to the
location where csplot.py and hw5pr1.py are located. Here are brief instructions
for PCs and Macs:
- PC:
Go to the Start menu's Run
option and type cmd. Then, type cd Desktop at the
terminal window's prompt. (Go to wherever your files are.) Once there,
type c:\python25\python -i hw5pr1.py.
- Mac:
Go to the Applications folder into the Utilities subfolder and open the Terminal application.
At its prompt, type
cd Desktop. (Go to
wherever your files are.) Once there, type python -i hw5pr1.py.
Please ask if you run into any problems with this!
Between runs if you make any changes to your code you
will need to reload it into python. The easiest way to do this is to follow
these instructions:
Easy ways to exit and reload
your Python program: Mac and PC To leave the
python shell, use the shortcuts: control-d on Macs and control-z then
enter on PCs. Alternatively, you can type quit() on
either system. Then, in order to reload your new hw5pr1.py file,
hit the up-arrow key and hit return. That's it!
Now, onto the extensions...
There is a function in csplot named
csplot.getKeysDown() that returns a string with
the keys being pressed. In fact, the keys have to be pressed when the focus is
on the drawing window -- it's only possible to get that kind of keyboard
information from the graphics system (and not the Python shell).
You can use this function in order to set a boolean
variable that determines whether or not to run the updating step or to pause it
or step it by only one generation. Something like this:
if pause == False:
B = createNextLifeBoard( oldB
)
where the boolean value pause starts at False, but can be changed as follows:
keysList = csplot.getKeysDown()
if 'p' in keysList: pause =
True
Warning:
do not write another loop inside of the main while loop. What may happen is
that the code will get caught in the inner loop and never escape. Or, the inner
loop will call nothing except csplot.getKeysDown(), which floods the I/O
system with too many calls and causes Python to hang.
So, be sure to keep the csplot.show(B) line and the time.sleep line
within your constantly-running while loop -- otherwise, the
loop will run too fast, and the calls to csplot.getKeysDown can not keep up.
Try implementing these four
key-presses:
· 'p' in order to pause the generation-updating.
· 'r' in order to resume the generation-updating.
· 'q' in order to quit the main while loop (and the program).
· '1' in order to advance only 1 generation and then pause.
There might be other options you'd like to add for
different keys -- for example, you might have a color-swapping key or a key
that randomly adds live cells to keep things moving... . Try at least the four
keys listed above -- add others as you see fit... .
Variations on the game of life [up to
+5 points e.c.]
Finally, you can choose to implement one of two
variations on the game of life.
Variation One: the
doughnut For this variation, remove
the margin of empty cells around the board. In this case, the board should have
the topology of a doughnut -- so that the left and right edges of the board
become neighbors, as do the top and bottom edges. This makes neighbor-counting
and avoiding out-of-bounds errors trickier. Yet with a single function that
"looks up" the actual location of any given row and col coordinates,
it's not too bad.
Variation Two: alien
life Life is considered a 23/3
cellular automaton, because cells survive with 2 or 3 neighbors (the two digits
before the slash) and they are born with 3 neighbors (the digit after the
slash). Many (perhaps all) of the other survival/birth possibilities have been
studied, as well. Some even have names: for example, 1358/357 is called
"Amoeba" and 1/1 is called "Gnarl." For this variation on
life, choose a different set of survival/birth rules, perhaps from this reference of them and
implement a key that switches between John Conway's Game of Life and your
chosen set of rules (with another key to go back).
If
you have gotten to this point, you have completed Lab 5! You should submit your hw5pr1.py file at the Submission Site.
Next