This page was automatically generated by NetLogo 3.0. Questions, problems? Contact feedback@ccl.northwestern.edu.
The applet requires Java 1.4.1 or higher. It will not run on Windows 95 or Mac OS 8 or 9. Mac users must have OS X 10.2.6 or higher and use a browser that supports Java 1.4. (Safari works, IE does not. Mac OS X comes with Safari. Open Safari and set it as your default web browser under Safari/Preferences/General.) On other operating systems, you may obtain the latest Java plugin from Sun's Java site.
created with NetLogo
view/download model file: SocialTies.nlogo
WHAT IS IT?
-----------
This model explores the spread of language variant change throughout a
network consisting of 'weak' and 'strong' ties between language community
members. (Milroy 2002) proposes that the proportion of 'weak' neighborhood
network ties determines the speed with which change propagates through a
community. The strength of a network tie is defined by its multiplexity and
'centrality' to a local community. Looking at
1. looseknit uniplex networks are susceptible to change.
2. weak ties provide bridges through which information and influence are
propagated.
This predicts cascade diffusion through multiple weak ties. When discussing
the plausibility of a weak tie theory, Milroy uses the following behavior to
found her reasoning:
1. People central to a close-knit, norm enforcing group are likely to find
innovation socially risky, but the adoption of an innovation already on the
periphery of the group less so.
2. Socially mobile individuals are forced to deal with out-of-network
people regularly, and accomodate to new language variants more freely.
To create a model that has a variable number of weak/strong ties, the
"small world" simulation was ideal.
HOW IT WORKS
------------
This model is an adaptation of a model proposed by Duncan Watts and Steve
Strogatz (1998). SETUP creates a connected network of NUM-NODES nodes with a
variable amount of 'clustering,' or close-knit groups that include members who
share friends. The lower the REWIRING-PROBABILITY, the greater the number of
nodes existing in close-knit groups.
During SETUP, a node is chosen at random to develop a new language variant
of the community's dialect. SPREAD CHANGE will spread this change throughout
the entire network. SPREAD ONCE will allow any people speaking the new variant
to effect change in any to which they are tied. The CLUSTERING COEFFICIENT is a
measure of the proportion of weak/strong ties in the network. A low clustering
coefficient is indicative of a network comprised of numerous weak ties.
Average Path Length: Average path length is calculated by finding the
shortest path between all pairs of nodes, adding them up, and then dividing by
the total number of pairs. This shows us, on average, the number of steps it
takes to get from one member of the network to another.
Clustering Coefficient: Another property of small world networks is that
from one person's perspective it seems unlikely that they could be only a few
steps away from anybody else in the world. This is because their friends more
or less know all the same people they do. The clustering coefficient is a
measure of this "all-my-friends-know-each-other" property. More
precisely, the clustering coefficient of a node is the ratio of existing links
connecting a node's neighbors to each other to the maximum possible number of
such links. The clustering coefficient for the entire network is the average of
the clustering coefficients of all the nodes. A high clustering coefficient for
a network is another indication of a small world.
HOW TO USE IT
-------------
The NUM-NODES slider controls the size of the network. The
REWIRING-PROBABILITY determines the fraction of nodes rewired from their
original neighbors. Choose a size and press SETUP.
When you press HIGHLIGHT and click on a node in the graphics window it
color-codes the nodes and edges. The node itself turns pink. Its neighbors and
the edges connecting the node to those neighbors turn blue. Edges connecting
the neighbors of the node to each other turn yellow. The amount of yellow
between neighbors can gives you an indication of the clustering coefficient for
that node. The NODE-PROPERTIES monitor displays the average path length and
clustering coefficient of the highlighted node only. The AVERAGE-PATH-LENGTH
and CLUSTERING-COEFFICIENT monitors display the values for the entire network.
If a "network is disconnected" message appears in the command
center, that means that the network got fragmented into two pieces and the
network properties were not plotted during that round. We do not want to
calculate and plot the average path length when the network is not one
component.
THINGS TO NOTICE
----------------
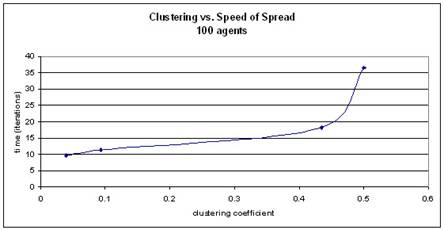
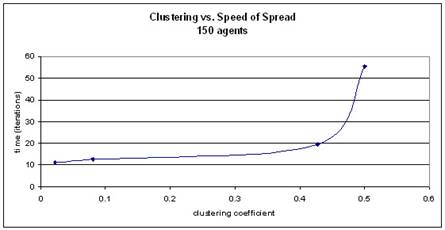
As the clustering coefficient lowers, the time it takes for a variant to
saturate the community drops (more weak ties means faster change).
Note that for certain values of the rewiring probability, the average path
length decreases faster than the clustering coefficient. In fact, there is a
range of values for which the average path length is much smaller than the
clustering coefficient. Networks in that range are considered small worlds.
The
following behavioral space explorations were conducting by looking at four
levels of REWIRING-PROBABILITY (0, 0.05, .5, and .95). Twenty trials were run for each pair of
this variable and agent number (40, 100, and 150) and averaged to get a data
point:
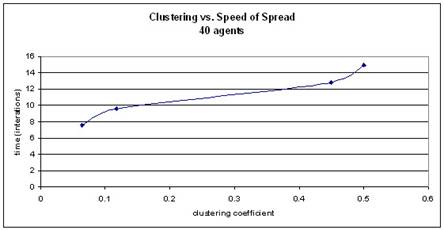
A
REWIRING-PROBABILITY of 0 indicates a network comprised solely of nodes
connected to their immediate left and right neighbors in the initial circle
layout. In this case, all ties are
strong. There are no weak ties to create
far-reaching bridges. A soon as a
few weak ties are introduced into the network (REWIRING-PROBABILITY of 0.05),
the time it takes to propagate the change drops drastically. As the number of weak ties is increased,
the change is spread faster still.
NETLOGO FEATURES
----------------
Both nodes and edges are turtles. Edge turtles have the "line"
shape. The edge turtle's SIZE variable is used to make the edge be the right
length.
Lists are used heavily in this model. Each node maintains a list of its
neighboring nodes. Lists are also used in the procedure that calculates
shortest paths and to find the clustering coefficient of a node.
RELATED MODELS
--------------
See other models in the Networks section of the Models Library, such as
Giant Component and Preferential Attachment.
CREDITS AND REFERENCES
----------------------
This model is adapted from:
Wilensky, U. (2005). NetLogo Small Worlds Model.
Duncan J. Watts, Six Degrees: The Science of a Connected Age (W.W. Norton
& Company,
The work described here was originally published in:
DJ Watts and SH Strogatz. Collective dynamics of 'small-world' networks,
Nature,
393:440-442 (1998)
The small worlds idea was first made popular by Stanley Milgram's famous
experiment (1967) which found that two random US citizens where on average
connected by six acquaintances (giving rise to the popular "six degrees of
separation" expression):
Stanley Milgram. The Small World Problem, Psychology Today, 2: 60-67
(1967).