|
||
| | ||
Several researchers [1,9,11,12,13,16,19,24] examined which lines should be drawn in a computer generated image to maximize the amount of information conveyed while minimizing the number of lines drawn. They observed that illustrators use edge lines, consisting of surface boundaries, silhouettes, discontinuities, and creases to separate individual parts and to suggest important features in the shape of each object. These static images represented edge lines with black lines of uniform weight.
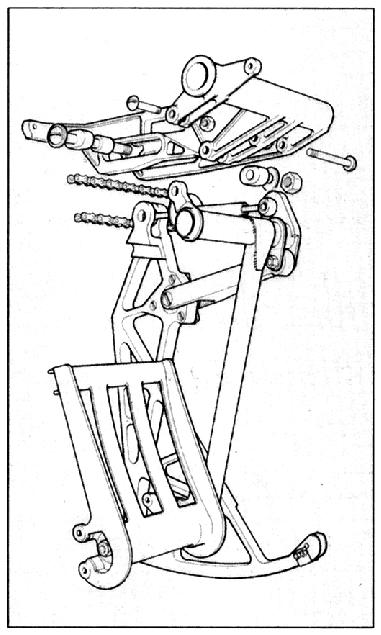
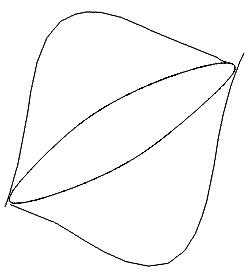
To decide which lines to draw, we started by analyzing some examples from hand drawn technical illustrations. The illustration in Figure 1 consists of just enough lines to separate individual parts and to suggest important features in the shape of each object.
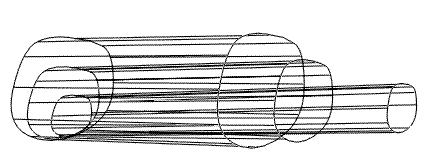
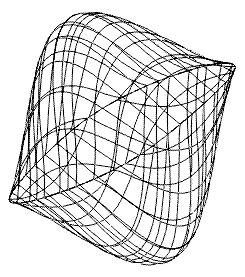
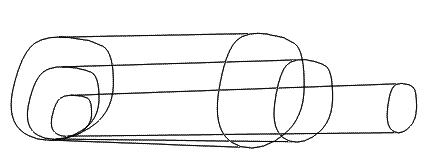
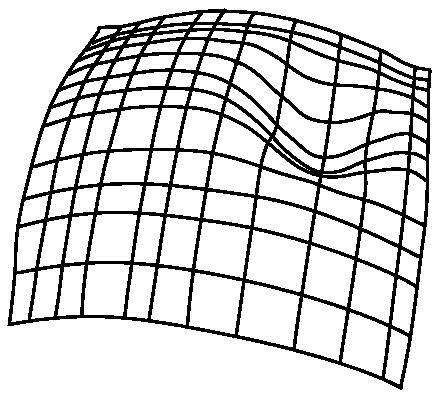
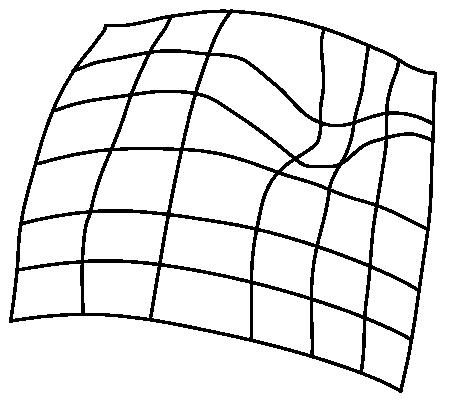
Most modeling systems display only a wireframe or a shaded image. A wireframe display is common because it can give a lot of information which is occluded by shading. However, a wireframe display of a complex model can be confusing due to the number of lines being displayed, as can be seen by comparing Figure 2 and 3. The wireframe of a Non-Uniform Rational B-Spline (NURBS) surface consists of isolines, which are parameterization dependent. Figure 4 demonstrates that changing which isolines are displayed can change the perception of the surface.
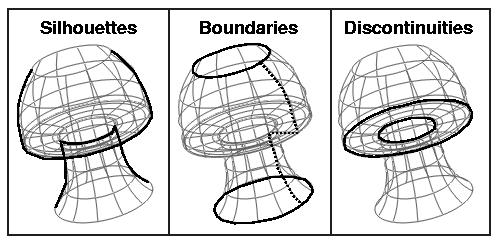
By drawing silhouettes, surface boundaries, discontinuities, and
creases, one can imitate the lines drawn in technical illustrations
without being parameterization dependent. An example of these
different line types is provided in Figure 5.
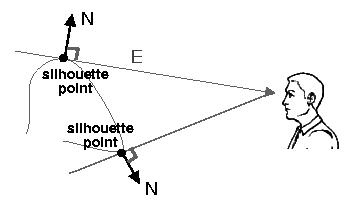
Silhouettes contain the set of points on a surface where =
0 or the angle between E and n is 90 degrees, given a point on a
surface, , with E as the vector from the eye to ,and n as the surface normal (Figure 6). Regions
where the surface normal changes abruptly, C1 discontinuities or
creases, are also important in defining the shape of an object. For a
polygonal model, a crease is determined by two front facing polygons
whose dihedral angle is above some threshold. In an interactive
system, the user should be allowed to control this parameter based on
the model and the intent of the image. Sometimes surface boundaries
also need to be drawn, but only in the case where there is not a
surface connecting another surface or where the joint between surfaces
changes abruptly. For example, the vertical boundary drawn in a dotted
line in Figure 5 should not be drawn, since it is a
shared surface boundary [15]. The calculations and
implementation details necessary to create these line drawings will be
addressed in Section 10 of the course notes.
 |
||
|
| ||
|
| |
|
|
| | |
|
|
| |