|
||
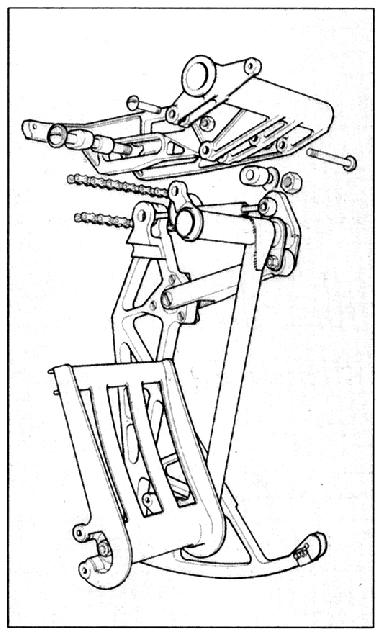
| Figure 3.2: An example of the lines an illustrator would use to convey the shape of this airplane foot pedal. Copyright 1989 Macdonald & Co. (Publishers) Ltd. [25]. | ||
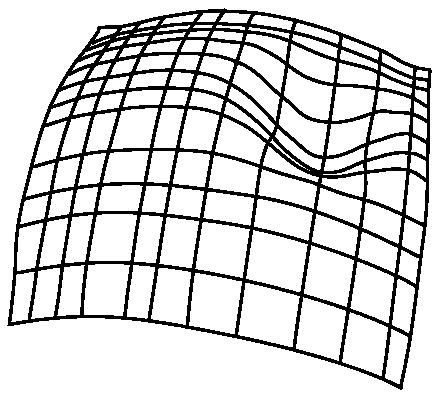
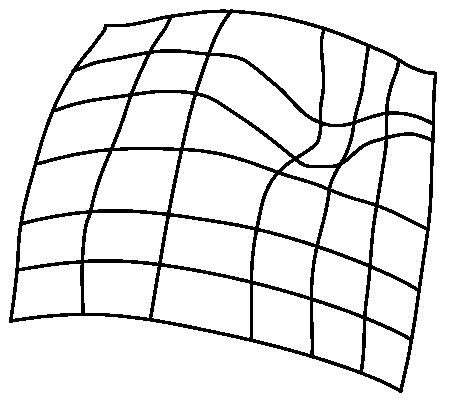
Most NURBS modeling systems display only a wireframe or a shaded image. A wireframe display is common because it can give a lot of information which is occluded by shading. However, a wireframe display of a complex model can be confusing due to the number of lines being displayed. The wireframe of a NURBS surface consists of isolines, which are parameterization dependent. Figure 3.3 demonstrates that changing which isolines are displayed can change the perception of the surface.
|
|
| Figure 3.3: Changing which isolines are displayed can change the perception of the surface. The image on the right looks as if it has a deeper pit because the isolines go thru the maximum curvature point on the surface. Images courtesy of David Johnson. | |
|
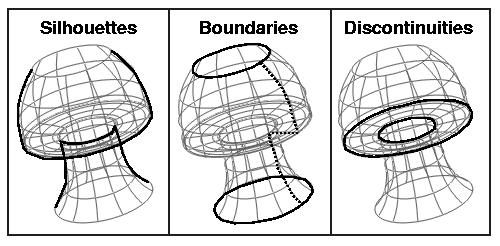
| Figure 3.4: Illustrators use lines to separate parts of objects and define important shape characteristics. This set of lines can be imitated for NURBS models by drawing silhouettes, boundaries, and discontinuities, shown above (drawn over the wireframe representation). |
|
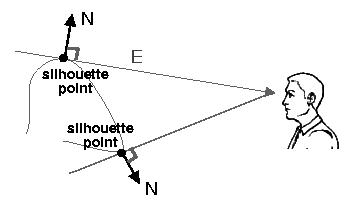
| Figure 3.5: Definition of a silhouette: At a point on a surface, and given E(u,v) as the eye vector and n(u,v) as the surface normal, a silhouette point is defined as the point on the surface where = 0 or the angle between E(u,v) and n(u,v) is 90 degrees. |
By drawing silhouettes, surface boundaries, and discontinuities for a NURBS-based model instead of isolines, one can imitate the lines drawn in technical illustrations without being parameterization dependent. An example of these three different line types is provided in Figure 3.4. Silhouettes contain the set of points on a surface where = 0 or the angle between E(u,v) and n(u,v) is 90 degrees, given a point on a surface, , with E(u,v) as the vector from the eye to , and n(u,v) as the surface normal (Figure 3.5). Regions where the surface normal changes abruptly, C1 discontinuities, are also important in defining the shape of an object. Sometimes surface boundaries also need to be drawn, but only in the case where there is not a surface connecting another surface or where the joint between surfaces changes abruptly. For example, the vertical boundary drawn in a dotted line in Figure 3.4 should not be drawn, since it is a shared surface boundary [18]. The calculations and implementation details necessary to create these line drawings will be addressed in Chapter 4.